Tolerance chart
Tolerance use instead of yes/no
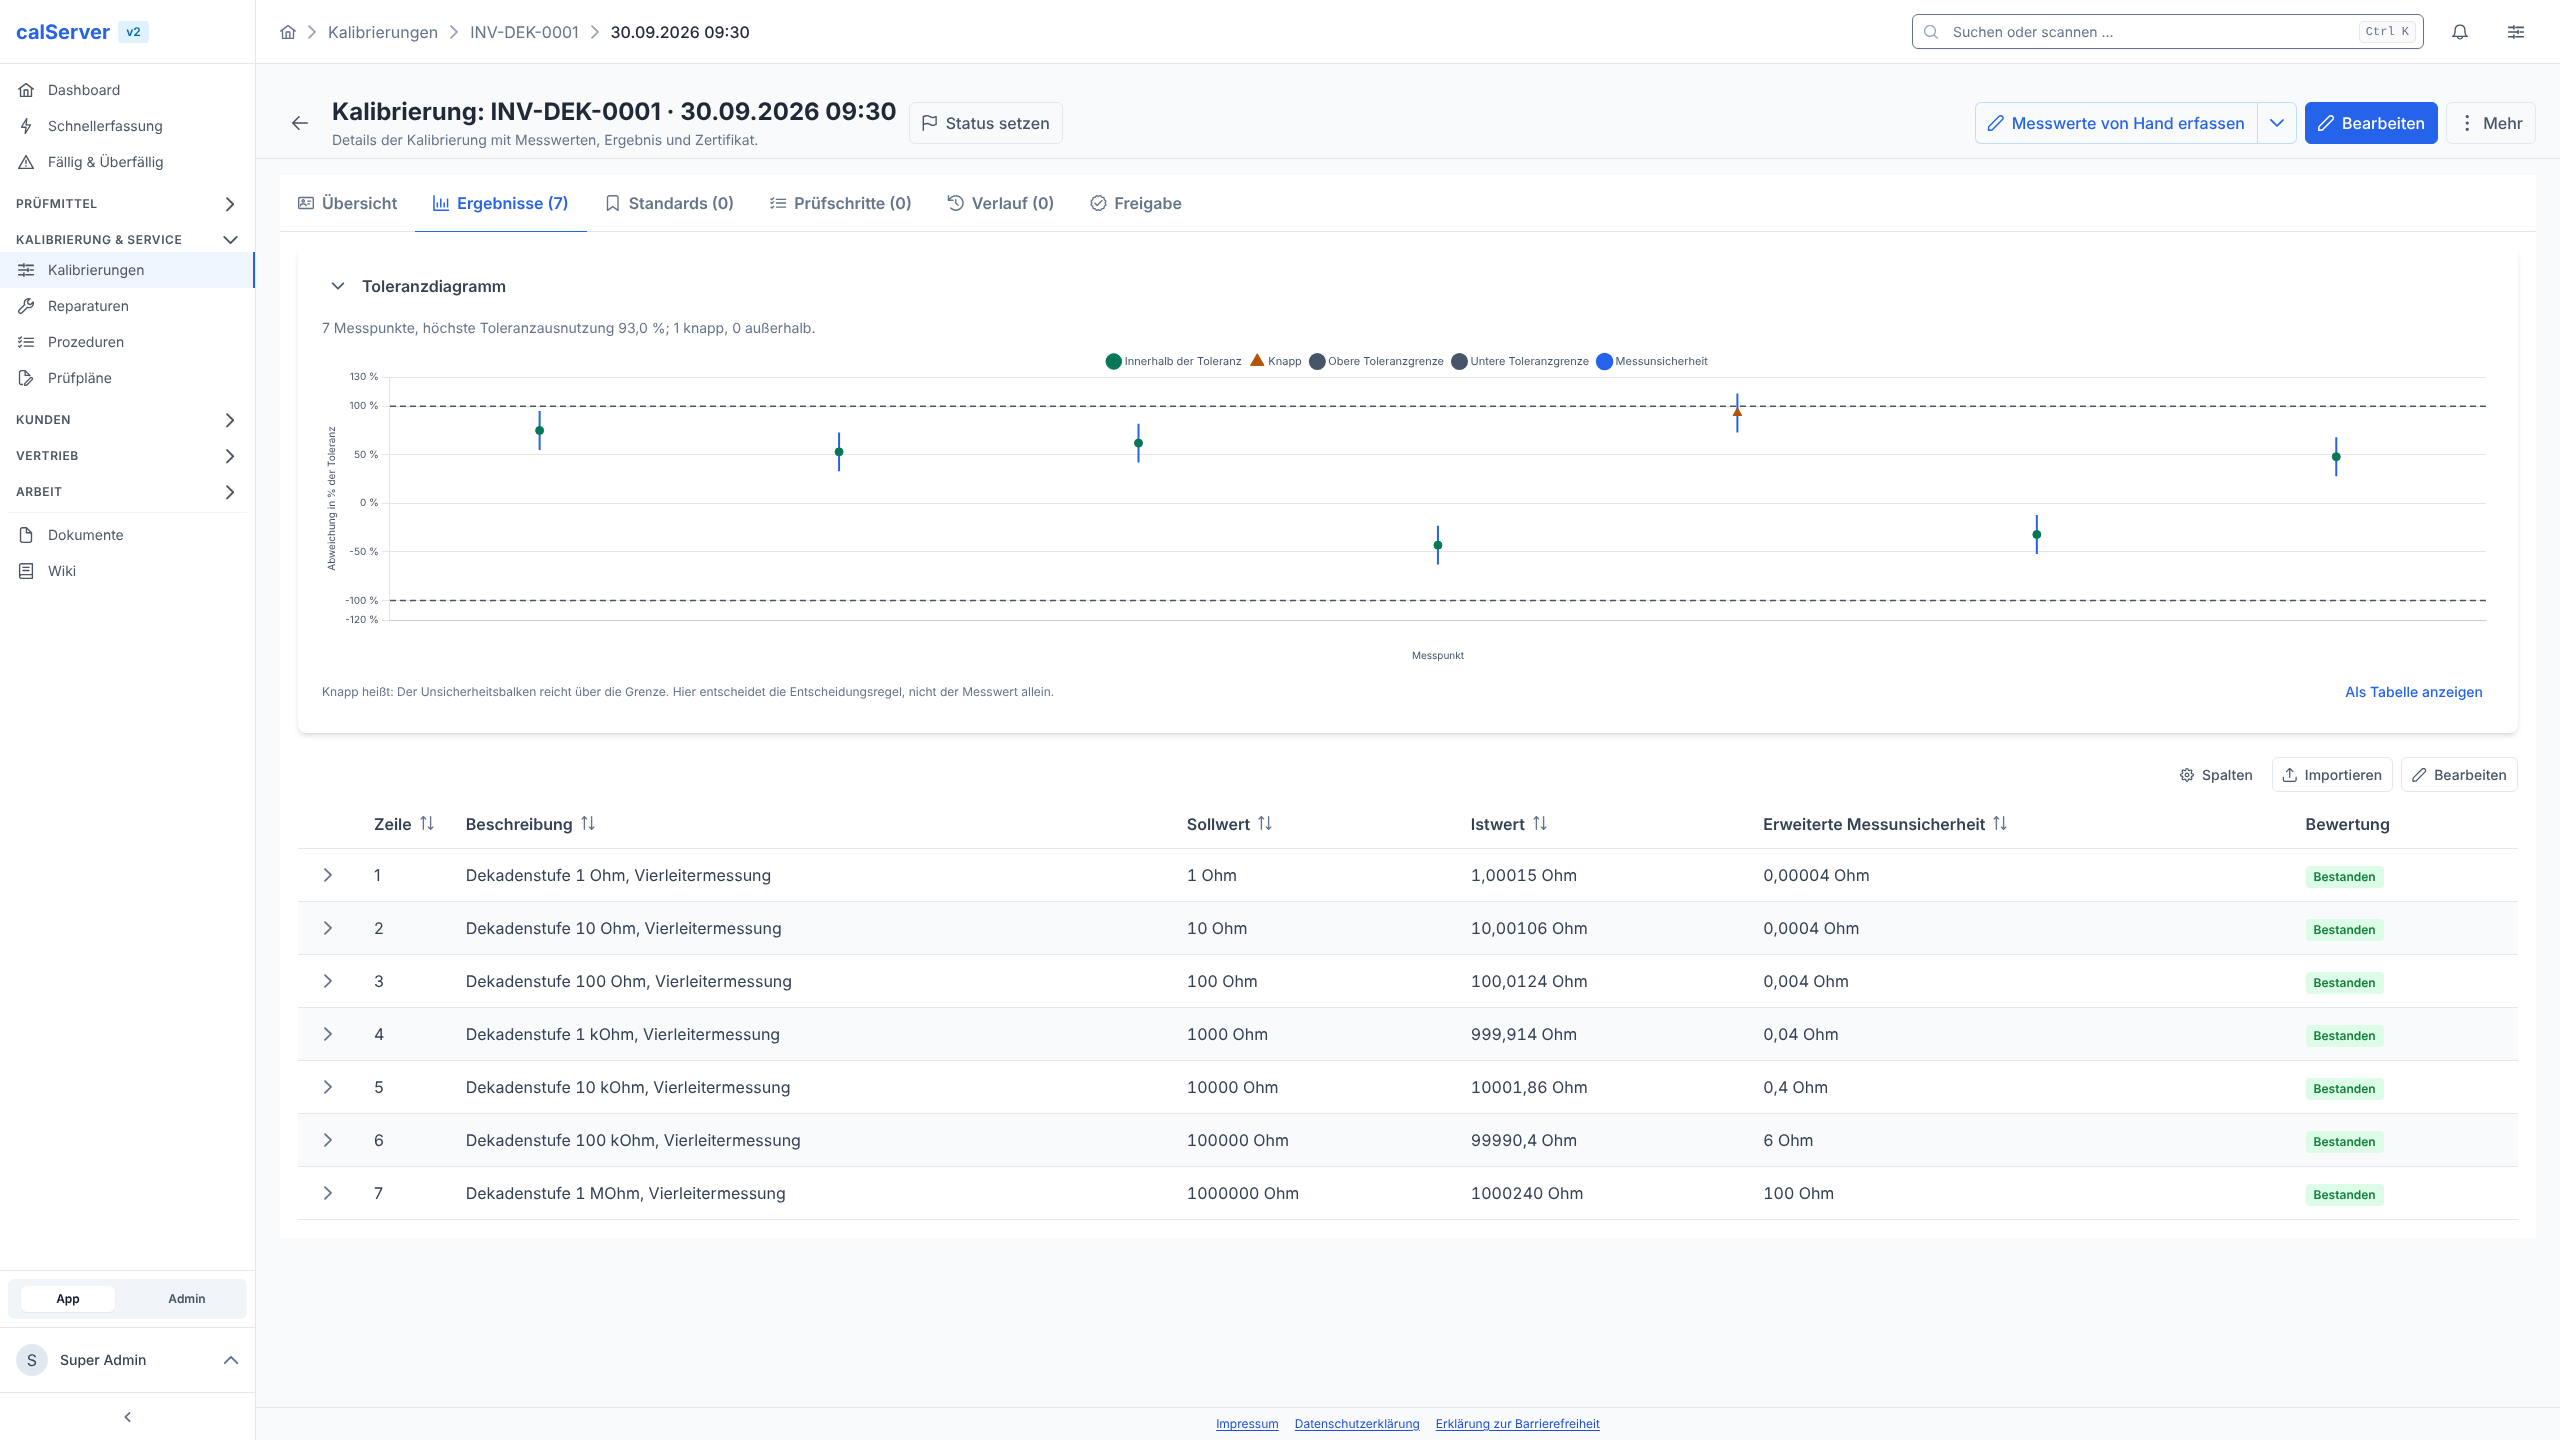
Every measuring point shows how much of the tolerance it uses, not just that it fits.
- Deviation as a percentage of the tolerance
- Uncertainty bar per point
- Close marking per ILAC-G8
Measurement analysis
Two analyses that turn measured values into a decision: how close was it, and where is the device heading?
Measurement uncertainty belongs in the picture, not in the footnote.
A calibration certificate says "passed". It doesn't say whether the measured value passed at 12 percent of the tolerance or at 93. But that is the number a lab uses to decide whether a device can run another year or needs adjusting now.
The tolerance chart plots each measuring point as a percentage of the tolerance, with the uncertainty bar around it. Points whose bar reaches beyond the limit are marked by calServer as close. There, the decision rule per ILAC-G8 decides, not the measured value alone. In the picture: seven measuring points, highest use 93 percent, one of them close, none outside.
The basics are in our wiki (in German): Measurement uncertainty explained simply and Decision rule.
Four calibrations of a voltage reference standard, with the trend line up to the next due date. Move the measured value and see when it gets close.
| Regel | Annahme bis | Urteil |
|---|---|---|
| Nichtbinär mit Schutzband | ±0,080 V | i.T. Konform |
| Binär mit Schutzband | ±0,080 V | i.T. Konform |
| Einfache Akzeptanz | ±0,100 V | i.T. Konform |
Trend: +0,018 V pro Jahr. Bei gleichem Verlauf liegt der Wert zur Fälligkeit am 16.03.2027 bei 10,084 V (?, in der Toleranz, Konformität nicht nachweisbar). Die Annahmegrenze wird voraussichtlich um den 27.12.2026 erreicht.
| Datum | Messwert | U | Urteil |
|---|---|---|---|
| 14.03.2023 | 10,012 V | 0,020 V | i.T. |
| 12.03.2024 | 10,031 V | 0,020 V | i.T. |
| 18.03.2025 | 10,048 V | 0,020 V | i.T. |
| 17.03.2026 | 10,066 V | 0,020 V | i.T. |
Rechenannahme für die Wahrscheinlichkeit: Normalverteilung um den Messwert mit u = U / 2. Das Beispiel ist symmetrisch; calServer rechnet obere und untere Grenze getrennt und bewertet einen Wert genau auf einer Grenze zugunsten der inneren Zone.
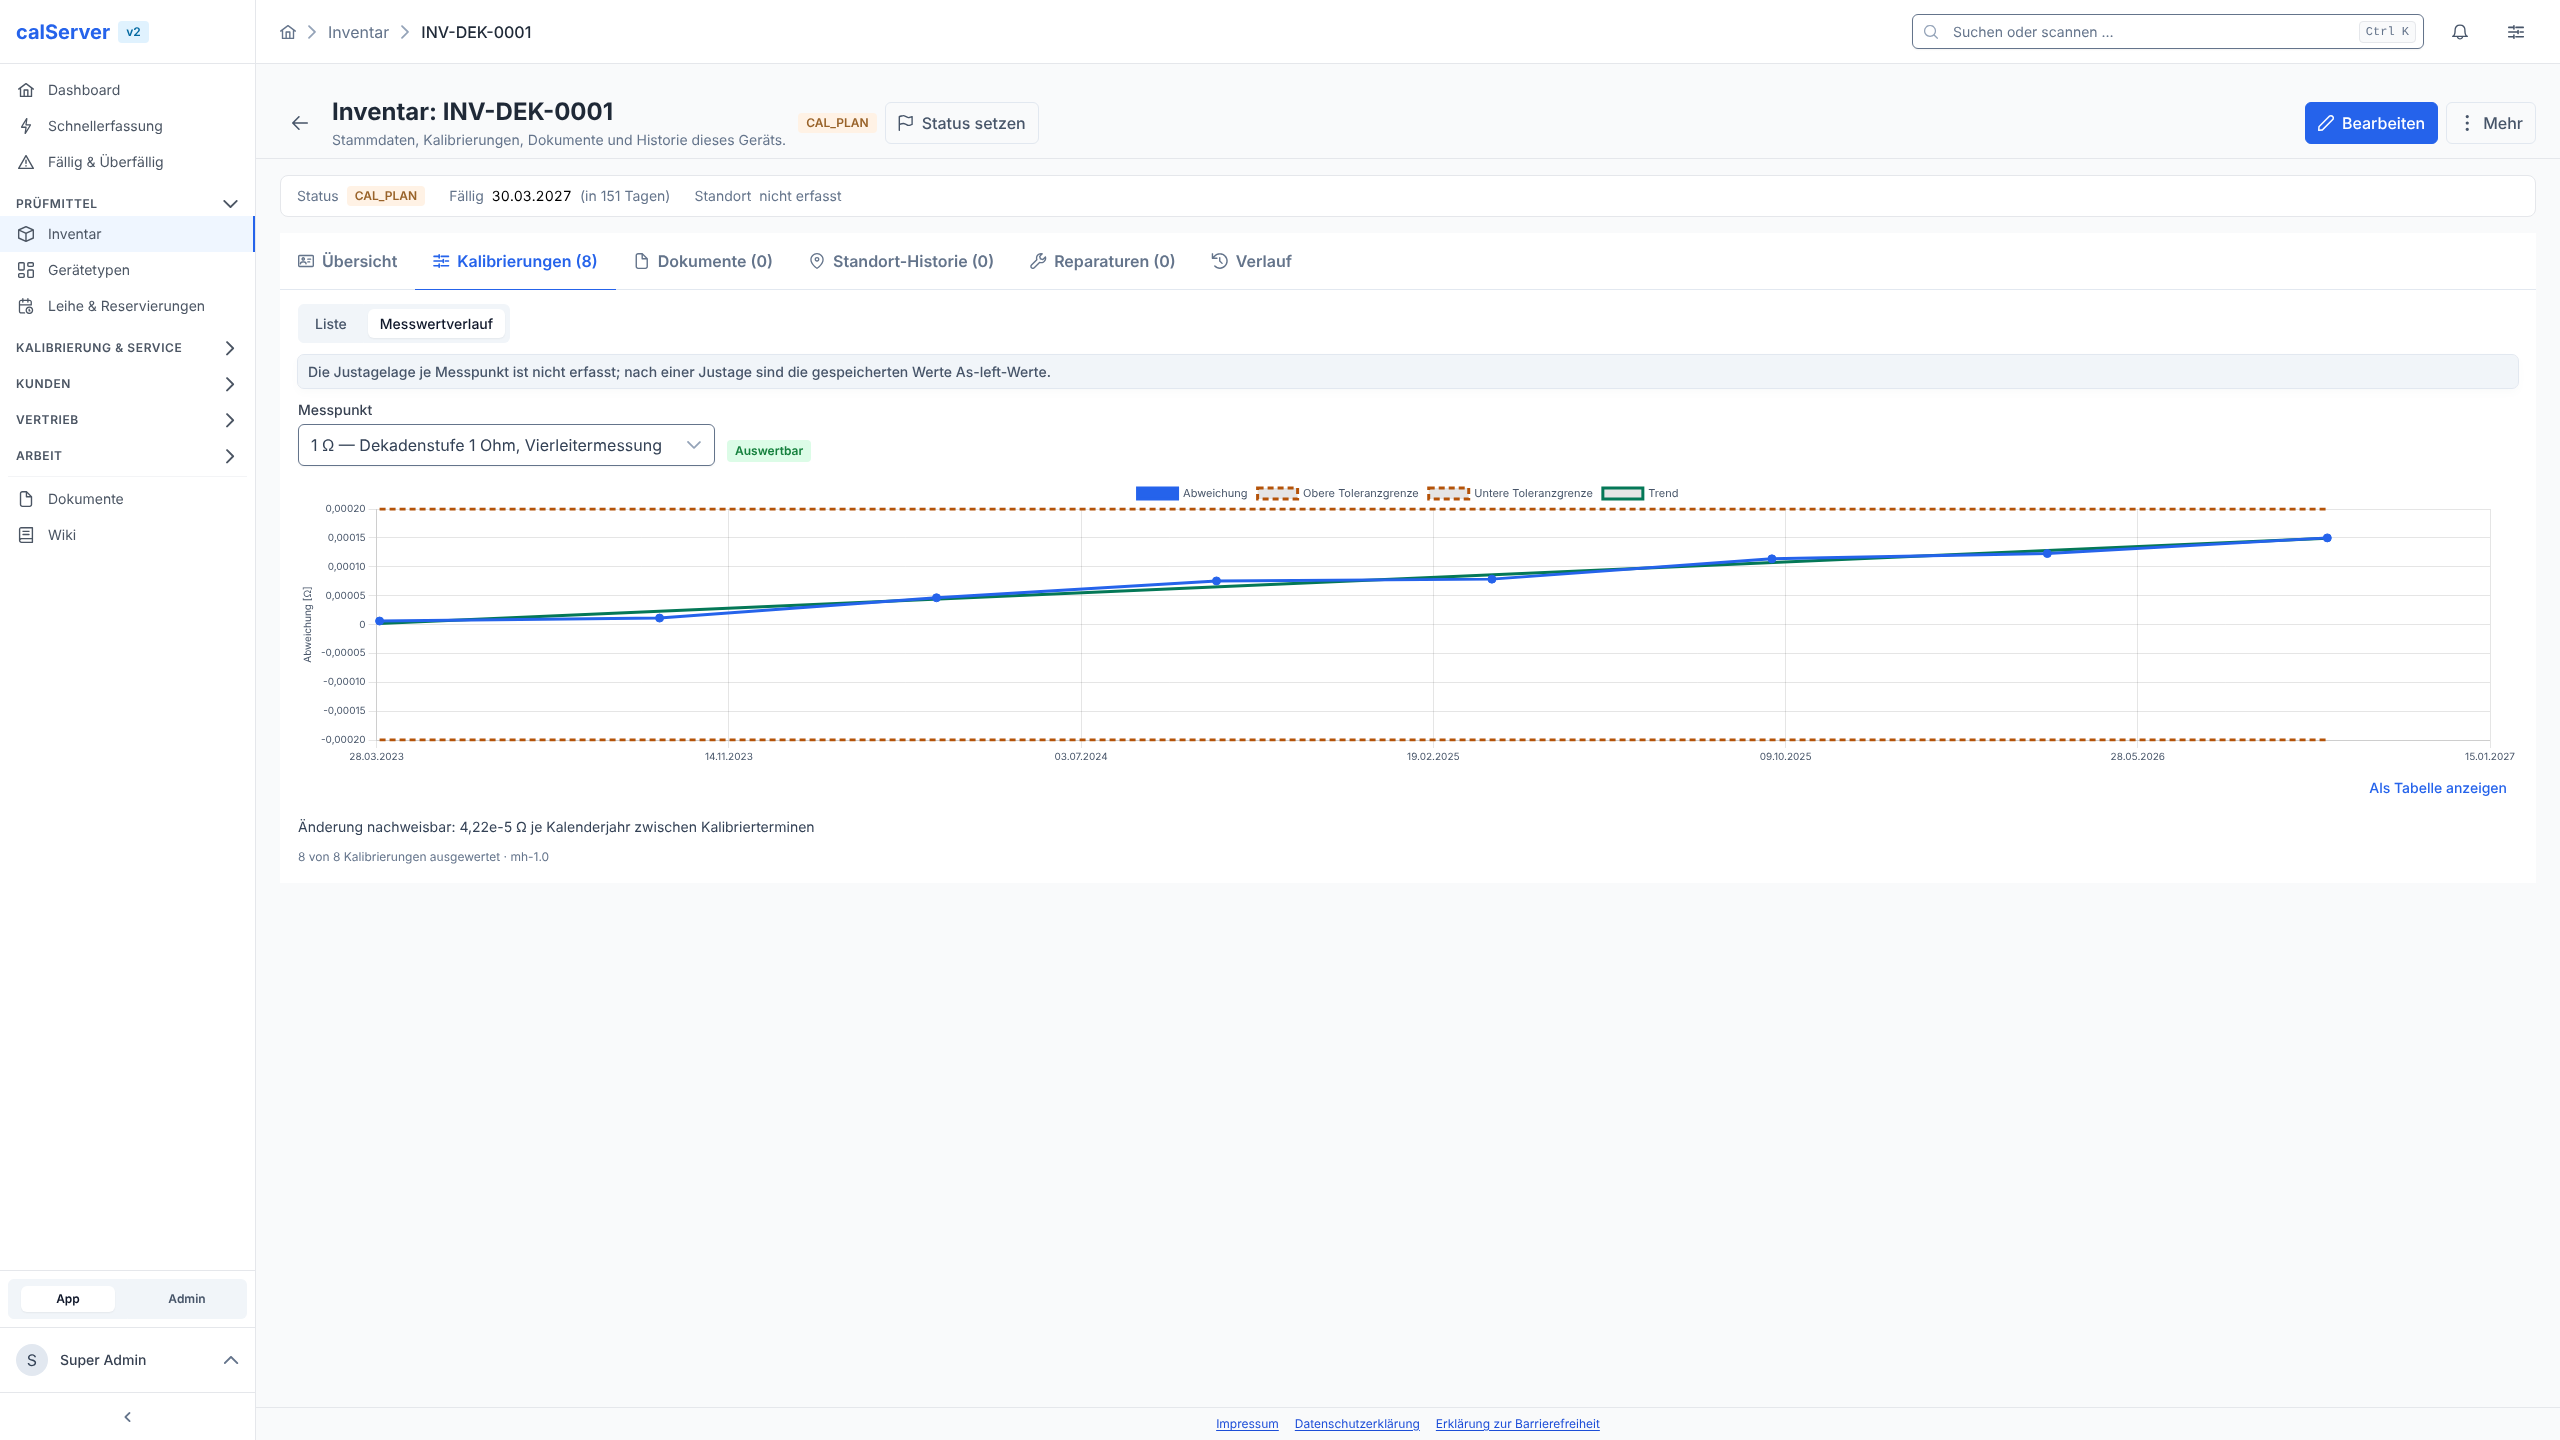
Eight calibrations, one measuring point, one statement.
A single calibration certificate is a snapshot. The question a lab really cares about is: is this device drifting away? Anyone who wants to read that from eight PDF certificates ends up typing numbers into Excel.
calServer analyzes the same measuring point across all calibrations of the device: deviation against calibration date, the tolerance band around it, a trend line inside. From four usable calibrations on, a t-test checks whether the slope is more than scatter. Only then does calServer call it detectable and quantify it per calendar year. That is the difference between "the curve looks like it is rising" and a number an auditor accepts.
More in our wiki (in German): Drift and Setting and adjusting calibration intervals.
Both work on the same measured values that are created during calibration anyway.
Tolerance chart
Every measuring point shows how much of the tolerance it uses, not just that it fits.
Measurement history
The same measuring point across all calibrations, with a tested slope instead of guesswork.
Point matching
Measuring points are matched by nominal value, type and range, even if the description changes.
Data hygiene
Whatever can't be analyzed is named instead of being silently included.
Measurement analysis
We show you the tolerance chart and drift analysis on your own calibration data.